


At the VSMC we believe that Value Stream Management has two primary functions:
- Optimizing the flow of work that delivers value
- Measuring value realization and using that feedback to determine what to do next
In this blog post, we are looking at what value actually is. In organizations, everyone broadly understands the concept of things having value or being useful but people’s perceptions differ; value is in the eye of the beholder.
In VSM’s case, our focus is the customer. Not the executive or shareholders, not the leader, not even the team. A core principle of VSM is that if we are successful in delivering the right things to the customer at optimum speed, assuming we have our cost models right, we will experience organizational success.
Organizational success means consistently achieving financial or other performance goals. In digital value streams, this can be determined by a number of factors:
- Customers actively using (and paying for) capability
- The rate at which new customers arrive
- Customers’ description of an experience
- Value stream financial health
Value realization is the fulfillment of desired outcomes. It’s when a customer experiences the value intended. The problem most organizations have is that they don’t measure this. Many don’t even think to look. The problem for teams is that they don’t have the capability or means to measure it. Or think they don’t. Or don’t have the time to look, before they are directed to work on the next thing.
BUT, only customer experience can give us true insights into the response to the work we do - and determine best what to do next.
There are many triggers for teams to inspect value realization. Some are ‘human’:
- Teams don’t know the outcome of their work which makes them feel they are lacking purpose. This is demotivating and leads to unhappy and unproductive teams.
- They may find it difficult to prioritize new activities (“everything is urgent”) and find it hard to convince stakeholders of investing in work that will improve the underlying delivery mechanisms.
- They may be acting like a “feature factory” where they are churning out code and enhancements without any understanding of their need or outcomes.
- They lack ways in which to align to organizational strategy and measure progress; for example, OKRs and KPIs
- At a higher level, organizational performance may be poor, and leadership is struggling to pinpoint exactly why when everyone is working so hard.
- Organizational performance is probably lackluster because new customers are not arriving, existing customers aren’t loyal or making referrals, and sales are down.
Others are more technical:
- Teams don’t have data telling them how their customers are responding to what they deliver.
- And while they subscribe to the tenet “We build it, we own it”, they cannot see their own real-time Profit and Loss (P&L) account.
- Their value stream or product/service’s Net Promoter Score is stagnant or dropping, despite them continually delivering changes.
- Or they have too much Work in Progress (WIP) and aren’t able to finish anything to deliver it.
- The link between feedback and planning doesn’t exist so new features are designed and developed without guidance from the prospective users.
- The team may find they have no way of seeing the impact of improvements
- Customers are leaving - retention is poor
- Customers are complaining
- Customer journey is slow
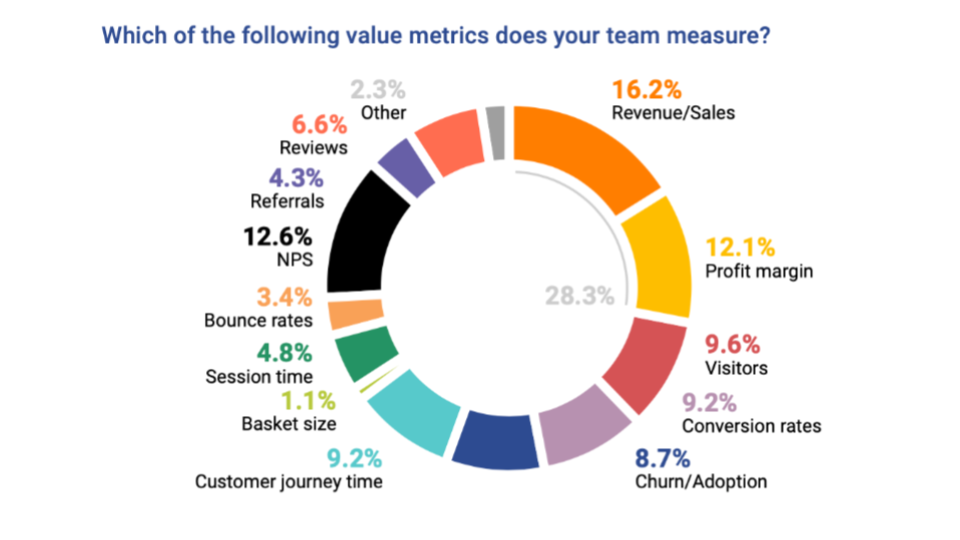
In the VSMC’s State of VSM Report 2021, we asked respondents about the metrics that their teams use to measure value. The results showed us that business value currently trumps customer value and that technology teams continue to be directed by “the business” and use financial metrics (revenue, sales, and profit margin) over customer experience measures. This means that, currently, revenue and profit are considered more important than customer delight.
Nearly 30% of responses related to the basic financial measures of revenue/sales, and profit margin. These are proxy metrics for customer experience. They are, of course, metrics that the business is interested in, but as Elon Musk has famously pointed out, from customer delight, comes all other things:
“Spend less time on finance, spend less time in conference rooms, less time on PowerPoint, and more time just trying to make your product as amazing as possible.”
NPS (net promoter score) is also a popular measurement for value and it is directly connected to the customer but is a lagging rather than a leading metric. While well-established and popular, the value of NPS as a value metric is questioned, for example in this Forbes article, which also explains why the volume of referrals is a better metric to indicate whether customers are receiving the value intended for them. Referrals are also a leading indicator that can help businesses to forecast future business.
Even better though, are real-time customer experience-based metrics that a team can use to sense feedback dynamically and make course adjustments quickly. Customer journey time, the number of visitors and conversion rates are popular here, but bounce rates and session times could be used too, particularly with AI-driven observability tools. The key is to tie changes in customer behavior to code changes to find insights into what delighted... and what didn’t.
Digital value streams combined with value stream management platforms give teams opportunities to understand and optimize the flow of their work to their customers in a way we’ve never been able to before. And we also have the opportunity to understand and respond to customer experience in the digital world faster and more accurately than we have ever previously been able.
When teams are continually delivering enhancements to customers, they can be continually observing what changes in their experience and responding to these short feedback loops. The value metrics we’ve traditionally used sit in the lagging column. Leading indicators give us much more runway to make our next choices about how to improve our product or service.
|
Leading |
Lagging |
|
|
Referrals and reviews appear in both the leading and lagging columns because they can be either - they tell us that in the past, customers were happy or not and indicate whether more customers will arrive in the future, or not.
The terms “leading indicator” and “lagging indicator” have become standard terminology in performance measurement and management. But the distinction between the two can sometimes be a bit opaque – some indicators are a bit of both, for instance.
Teams need to understand the difference between the two and ensure they have both types of metrics in place if they’re to build an accurate understanding of performance:
- A leading indicator looks forward to future outcomes and events
- A lagging indicator looks back at whether the intended result was achieved
The best way to manage performance is to merge the insights from backward-looking indicators (your lagging indicators) with more forward-looking insights and predictions (your leading indicators).
We also asked respondents about when they measured value:
-png.png)
Ideally, teams should measure the actual value realized continually, by having it instrumented into the product or platform (e.g., via a VSMP). But our 2021 research showed only 12.7% of respondents in that state. We also gave “At the end of the experiment” as an option and it’s also good; it shows the team is working empirically and experimentally and assumes new experiments will happen.
But more teams are measuring value at the end of a project, after a push to live or at the end of a sprint, perhaps having too much change to see what’s really happened in the customers’ hands or not allowing enough time for the change to be experienced. Value changes over time so we do need to revisit it.
Over half of respondents were not yet measuring value realized at all. And how could they, if they haven’t defined what value means to them and their customer?
Value means customers are having a positive experience. Only by looking for and seeing changes in customer behavior can teams be certain experience is changing. So next time your team writes a user story, make sure it’s an experiment where, after suitable (and multiple) periods of time, you’ll go see what changed. Did customer journey time accelerate? Bounce rates drop? Basket size increase? Reviews and referrals accelerate? Social sentiment warms up?
Value realization analysis is a step in continuous delivery.


Comments 0